
Advanced Speed Figure Analysis
Beyer was a vocal critic of the traditional, nebulous concept of “class.”
The assessment of thoroughbred performance has undergone a radical paradigm shift over the past half-century, evolving from rudimentary observations of final times and track variants to highly sophisticated, algorithm-driven performance metrics.
In the contemporary landscape of thoroughbred handicapping, speed figures serve as the foundational architecture upon which sophisticated wagering strategies and algorithmic betting models are built.
These metrics attempt to quantify the abstract—distilling the chaotic variables of a horse race, including track condition, pace, wind, weight, and ground loss, into a single, standardized numerical value.
This standardization theoretically allows for direct, objective comparison of equine athletes across varying distances, surfaces, and geographic locations.
However, with so many options—from the classic Beyer figures to the computerized models of Brisnet and Equibase, or the ground-loss adjusted “Sheets” like Thoro-Graph and Ragozin—the key for a bettor is knowing how each number is made and where to find the hidden value that the rest of the public is missing.
This exhaustive report provides a deep dive into the mechanics of thoroughbred speed figures, detailing their underlying mathematics, structural philosophies, optimal application environments, procurement costs, and precise integration into professional betting strategies.
Historical Evolution of Performance Metrics

Before modern speed figures, bettors used basic track variants to adjust final times, but these old-school averages were often misleading. They failed to account for the real quality of the field or how a track surface changed throughout the day. A “fast” variant might just mean the horses were cheap, not that the track was quick. Today’s handicapper needs a figure that separates the track’s speed from the horse’s actual talent to find the winning edge.
The fundamental objective of any speed figure is to normalize final times to account for the inherent speed of the racing surface, creating a universal comparative scale. The traditional arithmetic underlying basic speed ratings begins with a comparative subtraction.
The final time of a horse’s past performance is subtracted from the three-year best time at that specific distance and track.4 For example, if a horse completes a six-furlong sprint in 1:10 3/5, and the three-year track record is 1:08 2/5, the differential is 2 1/5 seconds (or 2.2 seconds).4
This differential is then multiplied by an estimated lengths-per-second multiplier. While traditional models utilized a multiplier of 5, advanced kinetic analysis suggests 5.5 lengths per second is a more accurate reflection of equine locomotion.4 Subtracting this product (11) from a base par of 100 yields a raw Speed Rating of 89.4
This raw rating must then be adjusted by a Track Variant. To compute this, the track variants for an entire day are separated into categories based on distance (route/sprint), surface (dirt/turf), and condition (dry/off track).4 The speed ratings of all winners in a specific category are averaged, and this average is deducted from the par of 100 to find the daily Track Variant.4
If the average winning speed rating for a dirt sprint on a given afternoon is 86, the variant is 14.5 A lower track variant indicates a faster, harder racing surface or a higher overall quality of competition.5
However, this foundational math is highly susceptible to skewing by outlier performances and has been largely superseded by proprietary algorithms that account for distance limitations, pace scenarios, and intricate daily surface fluctuations.4 The modern landscape is dominated by two distinct philosophical approaches: Final-Time Adjusted Figures and Comprehensive Performance Figures.
Final-Time Paradigms: Beyer, Brisnet, and Equibase
The first major category of contemporary speed figures is built primarily upon the foundation of final race times, adjusted for the inherent speed of the track variant and the distance of the event. While the end goal is identical—creating a universal numerical scale that allows bettors to compare a horse running in California against a horse running in New York—the internal mechanisms differ drastically between human-curated pars and automated computer projection models.
The Beyer Speed Figure Methodology and Pars
“Speed figures tell you how fast a horse ran in the past; they do not necessarily predict how it will run today.”
Popularized in 1975 by Andrew Beyer through his seminal text “Picking Winners,” and officially incorporated into the DRF past performances in 1992, the Beyer Speed Figure remains the industry standard for public consumption and general class evaluation.1 Beyer figures operate on an ascending numerical scale where a higher number denotes a mathematically superior performance.1 The scale is constructed so that elite Grade 1 stakes horses consistently achieve figures in the 110-120 range, solid allowance runners consistently hit the 100 mark, average $25,000 claiming horses run in the low 90s, and bottom-level $2,500 claimers earn figures in the upper 50s.3
Beyer Speed Figures, introduced in Andrew Beyer’s 1975 text “Picking Winners” and officially adopted by DRF in 1992, remain the industry standard for comparing horse talent. The figures operate on an ascending scale: elite Grade 1 stars consistently post 110-120, solid allowance runners hit 100, and $25,000 claimers land in the low 90s.
The system is built on “class pars”—expected winning speeds for every level at every track. These pars highlight circuit strength; for example, a Maiden Special Weight at Belmont Park has an 87 par, while the same condition at Thistledown is only 59. Figure makers determine the daily track variant by comparing actual times against these pars, keeping dirt and turf calculations strictly separate. If a horse beats a par by two points and the day’s average deviation is minus-2, they are credited with an official 88 Beyer.
To help bettors, the system standardizes beaten lengths based on distance: 2.5 points equals one length in sprints, while 2 points equals a length in routes. This mathematical distinction accounts for the higher aerobic demand of longer races. Because of this, a 90 figure represents the same level of athletic quality whether it was earned in a six-furlong dash or a 1 1/4-mile route, allowing for easy cross-distance comparisons.
Weight Adjustments within Final-Time Figures
A frequent point of contention among professional handicappers is the impact of weight carried by the horse. In true handicap races, weight swings can be severe. While the standard Beyer algorithm does not automatically integrate weight into the published figure, the creator has established a rigid mathematical conversion for bettors wishing to manually adjust for weight disparities.
Following extensive research in handicap-heavy jurisdictions like Australia, the Beyer formula dictates that one pound of weight is equivalent to four-tenths (0.4) of a point on the Beyer scale.11 Therefore, if a horse is assigned to carry 20 pounds more than it did in its prior start, a professional handicapper should manually subtract 8 points from its previous speed figure to project its capability in today’s event.11
Brisnet and Equibase

In stark contrast to the human-curated pars and manual interventions of the Beyer system, Brisnet and Equibase rely heavily on automated, computer-driven algorithms utilizing the “projection method”.3 These models analyze the past performances of every horse entered in a specific race, computing millions of data points to project exactly how fast the race should be run based on the aggregate capabilities of the field.3 The actual final time recorded on the track is then compared against this rigorous computer projection to generate the daily track variant.12
The philosophical dividing line between these providers is the removal of human subjectivity. Trackmaster, which produces the Equibase Speed Figures, reports that 99.999% of their figures are generated entirely without human adjustment.12 Brisnet shares a similar “the number is the number” ethos, arguing that strict adherence to computer-generated pars and variants removes inherent subjective bias and provides the most statistically accurate representation of a race’s quality over the long term, avoiding the temptation to artificially split variants just because a race “looked” faster or slower.12
Equibase refines its algorithm by utilizing an Inter-Track Variant (ITV), which measures the fundamental, structural differences between racetracks—accounting for the circumference of the oval, the banking and sharpness of the turns, and the exact physical composition of the dirt or synthetic surface.12 This ensures that a baseline performance at a tight-turned bullring is accurately scaled against a performance on a sprawling, sweeping oval like Belmont Park.12
Equibase calculations follow a precise three-step process: first, a “raw” figure is computed using the actual race time; second, the raw figure is adjusted by the appropriate ITV specific to track, distance, and surface; finally, the figure is adjusted by the Daily Track Variant (DTV), which represents the deviation between winning times and par times on that specific afternoon.6 Similar to Beyer, Brisnet utilizes a sliding scale for beaten lengths, where one length is approximately equal to 1.5 points in sprints and 1 point in routes.3
The Limitations of Final Time: Pace, Sectionals, and the Turf Dichotomy
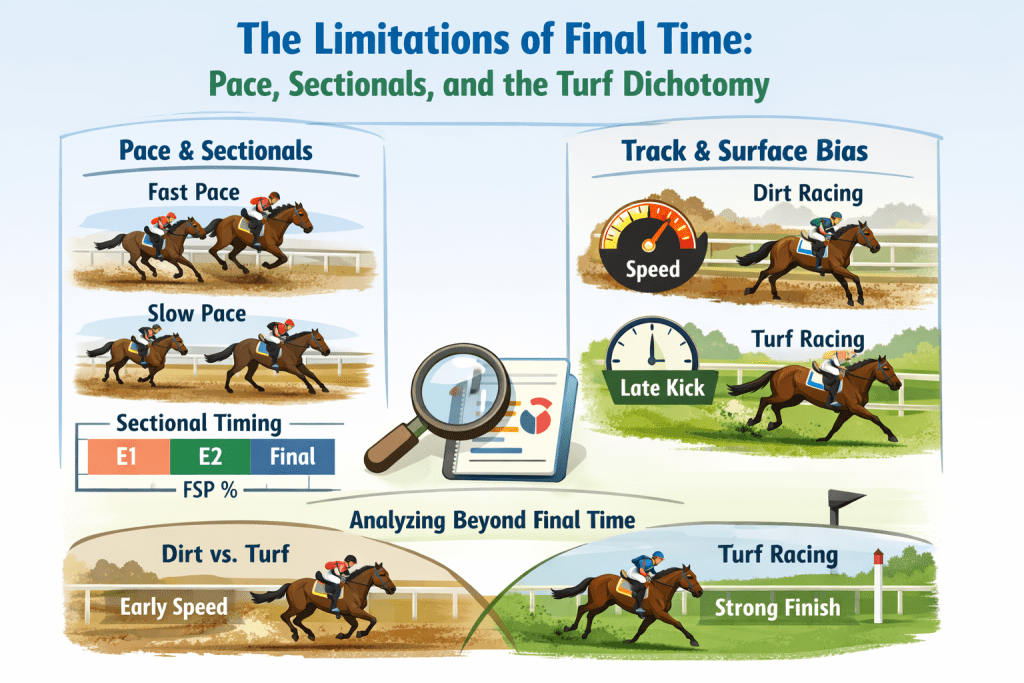
While final-time speed figures provide an excellent baseline for class capability, they possess a critical structural flaw: final time is overwhelmingly dictated by the pace of the race. The predictive validity of any final-time speed figure is entirely dependent upon the pace scenario the horse will face today compared to the pace scenario where the figure was earned.13
The Interaction of Speed and Pace Bias
A horse possessing a dominant 100 Beyer Speed Figure earned while galloping on an uncontested lead is highly vulnerable if today’s race features three other front-runners, creating a “hot” pace duel that will inevitably cause early aerobic exhaustion.13 Conversely, a deep closer who earned a massive figure by running past exhausted horses in a fast-paced race will struggle to repeat that figure if today’s pace is expected to be slow and uncontested.17
To rectify this, professional bettors integrate speed figures with pace analysis tools. TimeformUS approaches final-time figures by explicitly integrating pace dynamics into their final rating.19 Overseen by figure maker Craig Milkowski, TimeformUS is distinct in its willingness to allow human analysis to override computer algorithms.19
The platform’s proprietary Pace Projector and Early/Late Ratings provide a highly visual, color-coded map of fractional times, instantly indicating whether a race was run at a blistering or lethargic tempo.1
Similarly, Brisnet provides E1, E2, and Late Pace ratings to isolate how fast a horse runs in specific portions of a race, while EquinEdge utilizes a proprietary Pace Metric that correctly predicts the early leader 72.5% of the time.16
Track bias further complicates this matrix. An objective handicapper must determine if a horse’s peak speed figure was the result of intrinsic athletic ability or a “golden rail” that drastically enhanced the speed of inside runners on a specific afternoon.14 Speed figures earned on heavily biased surfaces must be treated with extreme skepticism.22
A historical example of track bias completely overriding standard form is the 2014 Breeders’ Cup at Santa Anita, where a massive speed bias resulted in nine front-running winners on dirt, allowing the 62-1 longshot Take Charge Brandi to wire the Juvenile Fillies field.23 Bettors strictly playing raw speed figures tossed her, while bias-aware bettors cashed massive tickets.23
The Dichotomy of Dirt vs. Turf Metrics
The calculation and application of speed figures differ radically between dirt and turf racing, dictating exactly what type of race these figures are best suited for. On North American dirt surfaces, races are traditionally run with intense, sustained early speed from the starting gate, gradually decelerating in the final furlongs.25
Dirt speed figures are thus highly reliable indicators of overall capability, as the horses are subjected to maximum aerobic stress throughout the entirety of the event.27 Therefore, traditional speed figures are undeniably best utilized in dirt sprints and dirt routes.
Conversely, turf racing—heavily influenced by European riding styles—is a highly tactical exercise characterized by severe early restraint followed by violent acceleration in the final quarter-mile.25 If a field of elite turf milers capable of running a mile in 1:35 plods through the opening six furlongs in a pedestrian 1:14, the laws of physics dictate they cannot accelerate fast enough in the final quarter to record a fast final overall time.25 Consequently, a horse whose baseline capability is a 90 Beyer might cross the wire earning a raw mathematical 70, rendering the figure entirely useless as a predictive tool.25
Because of this pace-induced distortion, turf races are a veritable “minefield” for speed figure makers.27 Taking slow final times on the grass at face value would result in elite stakes horses earning claiming-level figures.27 To rectify this mathematical imbalance, Beyer algorithms were fundamentally altered in 2015 for all turf races.
The underlying chart was modified so that every one-tenth of a second carries a slightly higher numerical value on grass than on dirt.25 Furthermore, because turf races so frequently result in tightly bunched finishes, figure makers determined that a three-length winning margin on the turf represents a far greater demonstration of athletic superiority than a three-length margin on the dirt, adjusting beaten-length penalties accordingly.25
Sectional Timing and Finishing Speed Percentage (FSP)
To effectively handicap turf races, or dirt races severely compromised by an anomalous pace, professionals integrate final-time speed figures with Sectional Timing data provided by technologies like Trakus or GPS tracking systems such as Total Performance Data (TPD).29 Sectional timing deconstructs a race into fractional segments, quantifying the exact energy distribution of an equine athlete across the topography of the racecourse.30
The critical metric derived from this data is the Finishing Speed Percentage (FSP). The FSP evaluates whether a horse ran the final section of a race faster, slower, or equal to its average speed throughout the entire race. The standard formula utilized in the industry is: FSP = (T * d * 100) / (D * t), where T is overall race time, t is sectional time (e.g., the final three furlongs), D is overall race distance, and d is sectional race distance.33
Every specific track profile has an optimal Par FSP based on its unique topography. For example, a downhill six-furlong sprint may yield an optimal Par FSP of 103%, while a grueling uphill 1 1/2-mile route may have a Par FSP of 112%, dictating that horses must race steadily in the early stages to finish efficiently.33 A horse that records a poor final speed figure but generates a massive, visually hidden late sectional burst (a highly efficient FSP in an inefficiently paced race) becomes a premier betting target in its next start, particularly when stretching out in distance.32
Comprehensive Performance Profiles: Ragozin and Thoro-Graph
Algorithmic final-time figures possess a critical blind spot that sharp bettors routinely exploit: the inability to account for ground loss. If a horse is caught 10 paths wide on the turn, runs an extra 100 feet of total distance, and finishes in a dead heat with a horse that saved ground on the rail, systems like TimeformUS, Brisnet, and Equibase will assign both horses the exact same final speed figure.19 The wide horse clearly ran a vastly superior race by maintaining the same final time despite covering significantly more ground, yet the automated algorithms remain entirely blind to this spatial reality.19
To capture the true measure of an equine athlete’s exertion, professional bettors and high-level owners frequently turn to “The Sheets”—specifically, the Ragozin Sheets and Thoro-Graph. Created by Len Ragozin and his former protégé Jerry Brown, respectively, these performance figures transcend final times by incorporating a comprehensive suite of spatial, physical, and environmental variables.1
Structural Differences and the Reverse Scale
Unlike the ascending scale of Beyer and Brisnet, The Sheets utilize a descending scale where a lower number represents a superior performance.1 On the Ragozin scale, a figure of 0 represents elite, Grade 1 Kentucky Derby-winning caliber, while a 20 indicates bottom-level claiming ability.1 Thoro-Graph figures operate on a similar descending scale but generally evaluate a few points lower than Ragozin; a 0 on Ragozin might translate to a minus-3 on Thoro-Graph, yet both accurately reflect the same performance tier.1
The defining characteristic of these comprehensive figures is their rigorous adjustment for external factors that directly influence energy expenditure:
Ground Loss: Using detailed video analysis and proprietary observation, these figure makers calculate exactly how wide a horse traveled around the turns.37 On the Thoro-Graph scale, every path a horse is shifted out from the rail on a turn equates to exactly one length of ground loss.44 If all else is equal, a horse racing in the 3-path around a single turn runs two full lengths farther than a horse on the rail.44 This distance is converted directly into the final performance number.
Weight Carried: Weight serves as an absolute anchor on kinetic energy. While traditional figures often ignore weight, The Sheets explicitly factor it into the core algorithm. On Thoro-Graph, an additional 5 pounds of weight carried equals an adjustment of 1 point across all distances.44 If two horses have historically run a Thoro-Graph figure of 10, the horse carrying 115 pounds holds a 1-point (or roughly 1 length at 5 furlongs) mathematical advantage over the horse carrying 120 pounds.44
Wind Velocity and Direction: Factoring in precise anemometer readings from local airports, these figures adjust for the resistance a horse faces running into a headwind down the backstretch versus the assistance of a tailwind in the homestretch, which can drastically alter final times.1
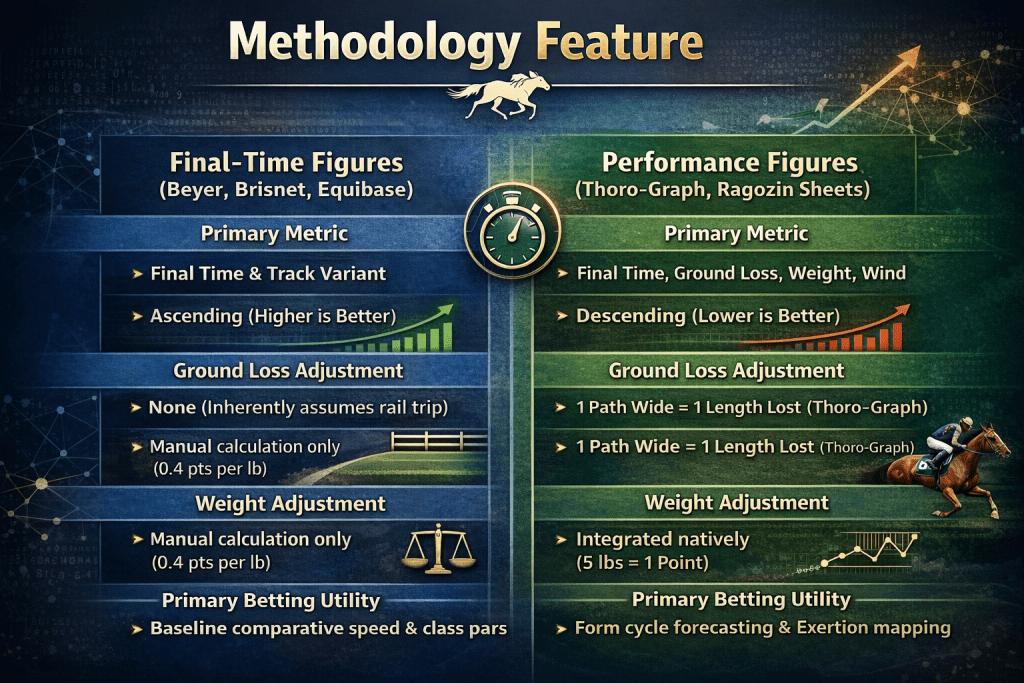
| Methodology Feature | Final-Time Figures (Beyer, Brisnet, Equibase) | Performance Figures (Thoro-Graph, Ragozin Sheets) |
| Primary Metric | Final Time & Track Variant | Final Time, Ground Loss, Weight, Wind |
| Scale Direction | Ascending (Higher is Better) | Descending (Lower is Better) |
| Ground Loss Adjustment | None (Inherently assumes rail trip) | 1 Path Wide = 1 Length Lost (Thoro-Graph) |
| Weight Adjustment | Manual calculation only (0.4 pts per lb) | Integrated natively (5 lbs = 1 Point) |
| Primary Betting Utility | Baseline comparative speed & class pars | Form cycle forecasting & Exertion mapping |
These intensive adjustments create figures that do not merely record how fast a horse ran from the starting gate to the finish line, but rather measure the exact quantum of physical effort the horse expended to achieve that result under the specific environmental conditions of the day.39 This distinction is critical for identifying hidden value and eliminating false favorites.
Form Cycle Analysis and the Physiology of Exertion

The ultimate utility of speed figures in betting strategies lies not in merely identifying which horse ran the fastest in the past, but in predicting which horse will run the fastest today. This requires an intricate understanding of Form Cycle Analysis and the heavily debated “Bounce Theory.”
The Bounce Theory: Biological Regression to the Mean
In thoroughbred performance analysis, a “bounce” refers to a severe regression in form following an unusually strong, maximum-exertion effort.37 The theory, pioneered by Len Ragozin and heavily utilized by Thoro-Graph players, is rooted in the biological reality of physiological homeostasis. Equine athletes, much like human sprinters, possess a finite reserve of anaerobic energy and physical durability.
When a horse runs a race that yields a speed figure significantly faster than its established baseline—often marked by a 10+ point jump on the Beyer scale, or a sudden multi-point drop on The Sheets—it taxes the central nervous system, respiratory system, and muscular structure to a point of temporary exhaustion.46
If a trainer enters the horse in a subsequent race without allowing adequate recovery time, the horse will invariably “bounce,” delivering a dull, enervated performance that cannot be predicted by traditional class or pace handicapping, nor can it be seen visually in the post parade.37
Astute bettors utilize speed figures to actively bet against horses that are heavily favored off a massive, uncharacteristic peak figure, recognizing the high statistical probability of a physiological regression.46 This is particularly prevalent in lightly raced, young horses that improve too quickly before building a proper aerobic foundation.46 Furthermore, bettors must watch for the “second-race-back syndrome,” where a horse fires a massive effort fresh off a long layoff, only to bounce severely in its second start due to the delayed physiological toll of the return race.40
Recognizing Thoro-Graph Patterns
Form cycle analysis using Thoro-Graph or Ragozin Sheets involves analyzing the graphical spacing of a horse’s past figures to predict future biological trajectories.1 Because the figures are presented visually on a grid spanning up to four years, users can identify established biological rhythms and resting phases.40
Performance fluctuations are strictly categorized into four distinct pattern movements based on the horse’s “effective top” (its best figure from its last six starts) 44:
Top: A figure more than one full point better than the horse’s previous effective best.44
Pair: A figure within one point (better or worse) of the previous top effort.44
Off: A regression of more than one point, up to four points slower than the effective top.44
X (Bounce): A severe regression of more than four points slower than the effective top.44
Statistical analysis of dirt race patterns reveals deep predictive insights across age demographics. Data indicates that three-year-olds are highly likely to exhibit rapid improvement, producing a higher percentage of “Pairs” and “Tops,” whereas older horses (five years and up) generally follow patterns of stagnation or decline, making them more susceptible to bounces.53
| Thoro-Graph Designation | Definition | Betting Strategy Implication |
| Top | > 1 point improvement over baseline | Prime candidate for regression (Bounce) if wheeled back too quickly; bet against if favored. |
| Pair | Within 1 point of baseline top | Indicates consolidated fitness; highly reliable to fire maximum effort; optimal betting target. |
| Off | 1 to 4 points slower | Normal physiological resting phase; often pre-empts a new Top in a form cycle. |
| X (Bounce) | > 4 points slower | Severe regression; requires significant layoff or drastic class drop to recover form. |
The most powerful predictive pattern in form cycle analysis is the “Pair-Pair-Pair” sequence. When a young horse runs three consecutive races pairing its top figure, it indicates a massive accumulation of foundational fitness without over-exertion. Statistical modeling indicates that a three-year-old on a Pair-Pair-Pair pattern will fire a massive new “Top” or another “Pair” in its next start an astonishing 72% of the time.53 A horse running a “Pair” after a “Top” is consolidating its fitness, indicating a high likelihood of a sustained peak, making them immensely profitable betting propositions.53
Strategic Betting Integration: Layoffs, Class Pars, and Race Selection

Integrating speed figures into a profitable betting strategy requires moving beyond the raw numbers to evaluate the specific conditions of the upcoming race. Certain types of races are highly conducive to speed figure handicapping, while others require extreme caution.
Evaluating Maiden Races and Second-Time Starters
Speed figures are particularly lethal in identifying hidden value in maiden races (races for horses that have never won).13 Lightly raced juveniles or second-time starters often exhibit massive performance leaps that are obscured by basic running lines.16
If a debut runner produces a raw figure 15 points below the maiden par but demonstrated elite early speed before tiring, or encountered a troubled trip causing severe ground loss (identifiable via a high Thoro-Graph figure despite a poor finish), that horse becomes a premier wager as a second-time starter.
The combination of race experience, natural physical maturation, and strategic adjustments (such as a jockey switch or equipment change) often triggers an explosive spike in their speed figure pattern that the general betting public will miss.16
The Artificial Aging Dilemma and Layoff Handicapping
Handicapping horses returning from extended layoffs requires careful navigation of class ratings and speed figure aging adjustments. Because young horses naturally mature and increase their baseline speed, algorithmic class ratings (such as those used by TrackMaster/Equibase) automatically inflate the “par” expectation as the calendar turns.6 For example, a $20,000 claiming race for 3-year-olds run in February might carry a computed class par of 81. By November, assumed physical maturation pushes the par for that exact same condition to 84.6 On average, algorithms assume 3-year-olds will naturally run 3 rating points (or 0.6 seconds at a mile) faster after aging nine months.6
This creates a distinct betting vulnerability. If a 3-year-old runs an 81 in February and is subsequently sidelined due to injury, returning to the track in October, algorithms may suggest the horse is inherently class-advantaged or perfectly suited for an 84-par race. However, this is an artificial illusion; the horse has simply “aged” into a higher expected par on paper without actually demonstrating that physical maturation on the track.6
To correctly handicap a layoff using speed figures, bettors must synthesize the historical speed baseline with current trainer layoff statistics (e.g., a trainer’s win percentage off >90-day breaks) and a rigorous analysis of the recent workout pattern.58 Bettors must search for tight, consecutive “bullet” drills that indicate sustained cardiovascular fitness rather than mere prep work.58 A trainer who wins at 20% overall might only win at 8% with layoff horses, making a historically fast horse a highly vulnerable favorite if returning from a long break under that specific trainer.59
Establishing Class Pars Across Racetracks
A fundamental application of final-time figures is establishing “class pars”—the average winning speed rating for specific race conditions (e.g., maiden, claiming, allowance, graded stakes) based on historical data across specific age groups.6 In the American racing hierarchy, horses generally progress from Maiden races, through various Allowance conditions, up to Stakes and Graded Stakes competition.54 Conversely, horses that fail to compete are dropped into Claiming races, where they carry a price tag.54
Comparing a horse’s average speed figure against the par for today’s specific race class instantly identifies whether the horse is competitively spotted or grossly overmatched.17 For instance, a typical Grade 1 stakes winner will routinely post Beyer and Brisnet figures in the 106 to 110+ range, while an “Open” $10,000 claiming race winner might only require a figure in the low 80s to reach the winner’s circle.3 If a horse is stepping up from an Allowance race to a Grade 3 Stakes race, but its historical speed figure ceiling is an 88, the quantitative data dictates that the horse is physically incapable of winning the graded stakes race, regardless of visual impression or jockey selection.
Market Procurement, Pricing Ecosystem, and Arbitrage Valuation
The monetization of handicapping data has created a heavily tiered marketplace for speed figures, ranging from ubiquitous, low-cost options to highly expensive, proprietary services utilized exclusively by professional syndicates and high-volume bettors. Understanding the cost-to-value ratio of these products is essential for maintaining a positive Return on Investment (ROI) on betting capital.
Data Accessibility and Pricing Structures
| Data Provider | Primary Methodology | Standard Pricing Structure (2024 Estimates) | Platform / Procurement |
| Beyer Speed Figures | Final Time + Par Variant | $3.00 (Single Horse) to varying subscription tiers; embedded in DRF PPs. 8 | DRF.com; Daily Racing Form print editions.8 |
| Brisnet | Algorithmic Projection | Often provided free or heavily subsidized via ADW platforms. 17 | Brisnet.com; TwinSpires ADW.17 |
| TimeformUS | Pace-Integrated Final Time | $19.95 (5-card monthly) up to $1,272 (Unlimited Yearly). 63 | DRF ecosystem (Recent 166% price increase post-merger).63 |
| Thoro-Graph | Performance (Ground loss, Weight) | $25 (1st card), $20 (2nd card), $15 (3rd+). Individual races $5. 65 | Thorograph.com (Digital download grids).65 |
| Ragozin (The Sheets) | Performance (Ground loss, Weight) | Proprietary daily sheets; historical pricing models apply; $10 instructional CDs. 42 | TheSheetsOnline.com; direct purchase.42 |
The market divergence in speed figure availability is striking and dictates betting strategy. Brisnet figures are highly accessible and frequently subsidized entirely by Advanced Deposit Wagering (ADW) accounts for users who place bets through their platforms, making them the baseline metric for casual and recreational bettors.45 Because these figures are so widely distributed, betting solely based on the highest Brisnet figure rarely yields long-term value, as the pari-mutuel odds will compress heavily on that obvious horse.
TimeformUS recently underwent a significant market repositioning. Following its integration into the DRF ecosystem, users noted a massive 166% monthly subscription price increase (from $74.95 to $199.95 for certain tiers), shifting its target demographic firmly toward higher-volume players willing to pay a premium for pace-projected analytics.63
However, the true informational arbitrage exists in the premium tiers of the performance figures: Thoro-Graph and Ragozin. Thoro-Graph data requires a significant daily investment, costing $25 for the first product downloaded on a given day, with prices scaling down for subsequent downloads, and daily maximum caps ranging from $35 on weekdays to $95 on major weekend event days.65
Because these figures are relatively expensive and require a steep educational learning curve to decipher—specifically interpreting the reverse descending scale and the visual form cycle grids—the data they provide is not fully absorbed or understood by the general betting public.41 This creates a massive betting edge. For example, when a horse earns a massive, career-best Beyer Speed Figure by riding a golden, biased inside rail and saving all the ground, the general public will view that raw final-time number and bet the horse down to odds-on favoritism in its next start. The Thoro-Graph or Ragozin user, however, will look at the performance sheet and recognize that the effort was artificially aided by track physics and ground-saving geometry. Recognizing that the horse is a prime candidate for a biological “bounce” following that peak effort, the professional bettor will confidently wager against the public favorite, exploiting the severe discrepancy between public perception (raw final time) and physiological reality (actual performance exertion).43
Synthesis and Strategic Imperatives
Speed figures are the most critical and powerful diagnostic tool in modern thoroughbred handicapping, yet they remain inherently volatile and destructive to a bankroll if utilized in a vacuum. The evolutionary arc from archaic track variants to the algorithmic precision of Brisnet and Equibase, and finally to the holistic, physics-adjusted performance metrics of Thoro-Graph and Ragozin Sheets, reflects a continuous, industry-wide quest to mathematically quantify equine athletic potential.
To achieve long-term profitability in the pari-mutuel pools, a practitioner must recognize the distinct utilities of the various models. Final-time figures (such as Beyer and Brisnet) excel at establishing baseline class pars, mapping general capability, and measuring raw velocity, making them highly effective in cleanly run dirt sprints. Conversely, performance figures (The Sheets) are vastly superior at mapping biological form cycles, predicting physiological regression (bounces), and adjusting for the spatial realities of ground loss and weight, making them indispensable for high-level stakes races and complex routes.
Furthermore, the integration of these figures with pace dynamics, track bias diagnostics, and emerging sectional timing models (FSP) transforms handicapping from an exercise in historical observation into an act of sophisticated, high-probability spatiotemporal forecasting. By identifying the precise intersection where a horse’s physiological form cycle meets a favorable pace topography and a competitively viable class par, the astute bettor leverages speed figures not just to measure what happened in the past, but to mathematically anticipate the future.
Works cited
- Horse Racing Speed Figures Explained | America’s Best Racing, accessed February 21, 2026, https://www.americasbestracing.net/gambling/2020-horse-racing-speed-figures-explained
- What are Speed Figures? – EquinEdge, accessed February 21, 2026, https://equinedge.com/glossary/key-factors/speed-figures
- Handicapper’s Library: Brisnet Speed Ratings FAQ, accessed February 21, 2026, https://www.brisnet.com/racing/news/handicappers-library-brisnet-speed-ratings-faq/
- Article – Speed – Hor$ense, accessed February 21, 2026, http://www.ponypicker.com/speed.html
- How To Use DRF – Speed Figures, accessed February 21, 2026, https://help.drf.com/hc/en-us/articles/225544407-How-To-Use-DRF-Speed-Figures
- Using Speed and Pace Figures and Class Ratings – Equibase, accessed February 21, 2026, https://www.equibase.com/products/speedpace.pdf
- Understanding Beyer Speed Figures | Getting Out Of The Gate Official Site, accessed February 21, 2026, https://gettingoutofthegate.com/beyer-speed-figures/
- Beyer Speed Figures – Daily Racing Form | DRF | America’s Turf Authority Since 1894, accessed February 21, 2026, https://shop.drf.com/beyer-figures
- Beyer Speed Figures – Daily Racing Form, accessed February 21, 2026, https://promos.drf.com/beyer23
- Equibase® Speed and Pace Figures and Class Ratings, accessed February 21, 2026, http://tvg.equibase.com/newsite2/PremiumPP.cfm
- Ask Beyer: How to adjust weight for figures – DRF, accessed February 21, 2026, https://www.drf.com/news/ask-beyer-how-adjust-weight-figures
- Figure Makers: Hard-Core Computing – Paulick Report, accessed February 21, 2026, https://paulickreport.com/news/the-biz/figure-makers-hard-core-computing
- Handicapping 101 – Learning to Analyze Races with NYRA Bets, accessed February 21, 2026, https://racing.nyrabets.com/handicapping/handicapping-101
- What is Pace Analysis? | EquinEdge, accessed February 21, 2026, https://equinedge.com/glossary/key-factors/pace-analysis
- Winning With The Pace Calculator – American Turf Monthly, accessed February 21, 2026, https://www.americanturf.com/pace/sartinarticle.cfm
- What are Beyer Speed Figures? – EquinEdge, accessed February 21, 2026, https://equinedge.com/glossary/tools-and-resources/beyer-speed-figures
- Horse racing speed figures and class ratings explained – TwinSpires, accessed February 21, 2026, https://www.twinspires.com/edge/racing/horse-racing-speed-figures-and-class-ratings-explained/
- The Art Of Handicapping: This Is Basically How I Handicap Horse Racing!! – Reddit, accessed February 21, 2026, https://www.reddit.com/r/horseracing/comments/6sncgb/the_art_of_handicapping_this_is_basically_how_i/
- Speed numbers.. : r/horseracing – Reddit, accessed February 21, 2026, https://www.reddit.com/r/horseracing/comments/18fx7de/speed_numbers/
- Paulick Report Special: What’s in a Number?, accessed February 21, 2026, https://paulickreport.com/news/ray-s-paddock/paulick-report-special-what-s-in-a-number
- Horse Racing Pace Analysis: How to Use Pace Angles & Run Style Figures – – Caanberry, accessed February 21, 2026, https://caanberry.com/horse-racing-pace-analysis/
- Speed Figure Handicapping Horse Racing – YouTube, accessed February 21, 2026, https://www.youtube.com/watch?v=sI0izPRzj5A
- UNDERSTANDING TRACK BIAS – Horse Race Insider, accessed February 21, 2026, https://www.horseraceinsider.com/understanding-how-track-bias-aids-handicappers/
- How To Make Speed Figures Horse Racing – YouTube, accessed February 21, 2026, https://www.youtube.com/watch?v=LsiX_HBiIhk
- Ask Beyer: Key differences in making speed figures for dirt, grass races – DRF, accessed February 21, 2026, https://www.drf.com/news/ask-beyer-key-differences-making-speed-figures-dirt-grass-races
- Beyer on Speed | Speed Ratings : r/HorseRacingUK – Reddit, accessed February 21, 2026, https://www.reddit.com/r/HorseRacingUK/comments/w499tx/beyer_on_speed_speed_ratings/
- Figure Makers: An Open Mind Rules The Beyer Method – Paulick Report | Latest news and commentary from the horse racing and equine world, accessed February 21, 2026, https://paulickreport.com/news/the-biz/figure-makers-an-open-mind-rules-the-beyer-method
- Change In Beyer Speed Figures: Turf ‘Comparable’ To Dirt – Paulick Report, accessed February 21, 2026, https://paulickreport.com/horseplayers/change-in-beyer-speed-figures-turf-comparable-to-dirt
- Sectional Times and their uses in Horse Racing Analysis – Learn Bet Win, accessed February 21, 2026, https://www.learnbetwin.com/sectional-times-and-their-uses-in-horse-racing-analysis/
- Sectional timing by Simon Rowlands – Johnston Racing, accessed February 21, 2026, https://www.johnston.racing/wp-content/uploads/2019_03_Sectional-timing-by-Simon-Rowlands.pdf
- Sectional Timing on Sky Sports Racing and attheraces.com – YouTube, accessed February 21, 2026, https://www.youtube.com/watch?v=2CNBSKog2Hs
- Topic: What is the value of sectional timing? – The Racing Forum, accessed February 21, 2026, https://theracingforum.co.uk/forums/topic/what-is-the-value-of-sectional-timing/
- Par Sectionals and Finishing Speed Percentage (FSP) – RaceiQ, accessed February 21, 2026, https://raceiq.com/par-sectionals-fsp/
- How Do You Use Sectional Data to Identify Winners? Let’s Share Tips and Insights! – Reddit, accessed February 21, 2026, https://www.reddit.com/r/HorseRacingUK/comments/1kr3nqm/how_do_you_use_sectional_data_to_identify_winners/
- Sectional Timing in Horse Racing, accessed February 21, 2026, https://www.drawbias.com/sectionaltimes2.html
- Sectional Timing and Speed Figures Workshop – Stars Of The Clock Racing, accessed February 21, 2026, https://www.starsoftheclock.co.uk/sectional-timing-and-speed-figures/
- LEN RAGOZIN’S DATA CHANGED THE FACE OF HANDICAPPING AND HORSEMANSHIP, accessed February 21, 2026, https://www.horseraceinsider.com/len-ragozin-was-one-of-racings-great-originals/
- Len’s legacy – SAGE Horse Racing, accessed February 21, 2026, https://sagehorseracing.com/lens-legacy/
- What are Ragozin Numbers? – EquinEdge, accessed February 21, 2026, https://equinedge.com/glossary/tools-and-resources/ragozin-numbers
- The Basics – Thoro-Graph – Everything You Need to Win, accessed February 21, 2026, https://www.thorograph.com/basics
- All of this information is refined with a carefully crafted track variant down to one number for each horse in a given race. The lower the number the better the race. With few exceptions there will be a figure for every race a horse has run for the last four years. – Thoro-Graph – Everything You Need to Win, accessed February 21, 2026, https://www.thorograph.com/How2Use/index.html
- TABLE OF CONTENTS – The Sheets, accessed February 21, 2026, https://thesheetsonline.com/Pages/Introduction/PressKit2014.pdf
- What are Thoro-Graph Sheets? – EquinEdge, accessed February 21, 2026, https://equinedge.com/glossary/tools-and-resources/thorograph-sheets
- Everything you need to win – Thoro-Graph, accessed February 21, 2026, https://alpha.thorograph.com/assets/files/basics/howto.pdf
- Do You Use Beyer Speed Figures or Another Speed Figure? And Why? – Reddit, accessed February 21, 2026, https://www.reddit.com/r/horseracing/comments/1d80c6r/do_you_use_beyer_speed_figures_or_another_speed/
- What is a Bounce? – EquinEdge, accessed February 21, 2026, https://equinedge.com/glossary/handicapping/bounce
- Understanding Form Cycles – TwinSpires Blog, accessed February 21, 2026, http://blog.twinspires.com/2013/05/understanding-form-cycles.html
- When To Rule Out A Bounce : r/horseracing – Reddit, accessed February 21, 2026, https://www.reddit.com/r/horseracing/comments/1asp1bc/when_to_rule_out_a_bounce/
- Using Beyer Speed Figures – Derby Trail Forums, accessed February 21, 2026, http://www.derbytrail.com/forums/showthread.php?t=11616
- How to Understand Form Cycles in Horse Racing – YouTube, accessed February 21, 2026, https://www.youtube.com/watch?v=2YO-PTRxKoQ
- Tools of The Trade | AmWager | Online Horse Betting, accessed February 21, 2026, https://www.amwager.com/tools-of-the-trade/
- Guide to the Thoro-Pattern, accessed February 21, 2026, https://www.thorograph.com/assets/files/basics/thoropattern.pdf
- Ask the Experts :: ThoroPattern Patterns (2839 Views) – Thoro-Graph, accessed February 21, 2026, https://www.thorograph.com/phorum/read.php?1,26345
- Classifying the different types of horse races | News | Kentucky Derby, accessed February 21, 2026, https://www.kentuckyderby.com/horses/news/classifying-the-different-types-of-horse-races/
- Some Thoughts on Maiden Races – Cynthia Publishing, accessed February 21, 2026, https://www.cynthiapublishing.com/MitchellArticles/dm20000814.htm
- Speed Rating Class Pars – Inform Racing, accessed February 21, 2026, https://www.informracing.com/speed-rating-class-pars/
- Strategic Designs Ltd., forums – View topic – Question – speed, acceleration, stamina and potential – Starters Orders horse racing game, accessed February 21, 2026, https://www.startersorders.com/phpBB2/viewtopic.php?f=19&t=20492
- What is a Layoff? – EquinEdge, accessed February 21, 2026, https://equinedge.com/glossary/handicapping/layoff
- 10 must-know stats to use in horse racing betting – TwinSpires, accessed February 21, 2026, https://www.twinspires.com/edge/racing/10-must-know-stats-to-use-in-horse-racing-betting/
- New Handicapping Pages View: Speed & Class Ratings – TwinSpires, accessed February 21, 2026, https://www.twinspires.com/edge/racing/betting-info/new-fastbet-pages/speed-class-ratings/
- Speed & Class Ratings – TrackMaster, accessed February 21, 2026, https://www.trackmaster.com/articles/har/ratings
- Daily Racing Form: Leader Board – DRF, accessed February 21, 2026, https://www1.drf.com/drfLeaderBoard.do?category=beyer
- TimeformUS Merging with DRF Site, Monthly Subscription Increased by 166% – Reddit, accessed February 21, 2026, https://www.reddit.com/r/horseracing/comments/177p8n3/timeformus_merging_with_drf_site_monthly/
- DRF | America’s Turf Authority Since 1894 – Daily Racing Form, accessed February 21, 2026, https://www.drf.com/timeformus
- Pricing – Thoro-Graph, accessed February 21, 2026, https://www.thorograph.com/pricing
- Frequently Asked Questions – Thoro-Graph – Everything You Need to Win, accessed February 21, 2026, https://www.thorograph.com/faq
- The Sheets, accessed February 21, 2026, https://thesheetsonline.com/